Goal-Oriented BI
Literature review
Methodology lifecycle
The methodology lifecycle consists of three main steps involving iterations that build upon each other (Figure 3, with details in Table 2). The intention at a high-level is to allow organizations to model the current state, monitor their business, make decisions and finally monitor and refine the results. A first version of this lifecycle was introduced by Pourshahid et al. The one is this paper is more mature, more precise (in terms of steps and roles), and better supported by tools (on the URN and BI integration sides).
Figure 3
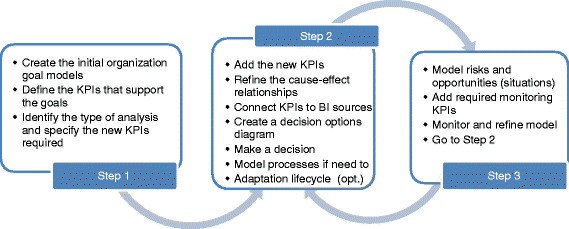
Goal-oriented, business intelligence-supported decision-making methodology lifecycle.
| Steps | Activity | Input | Output | Involved roles |
|---|---|---|---|---|
| Step 1 | Create goal models | Interview data | Goal models | Analysts: interviewers & modellers |
| Consumers: interviewees | ||||
| Define the KPIs | Interview data & existing KPI monitoring systems | Performance model | Analysts: interviewers & modellers | |
| Consumers: interviewees | ||||
| Identify analysis types & specify new KPIs | Goal and performance models | Analysis types | Consumers: identify the required analysis | |
| Step 2 | Add new KPIs | Performance model | Refined performance model | Analysts |
| Refine cause-effect relationships | Performance model | Refined performance model | Analysts | |
| Connect KPIs to BI data sources | Performance model | Performance model connected to BI data sources | BI Experts: BI related activities | |
| Analysts: Provide the required information for BI experts | ||||
| Create decision options diagrams | Interview data, business plans and other related documents | Decision model | Analysts: interviewers & modellers | |
| Consumer: interviewees | ||||
| Make a decision | Decision model, goal model and performance model | Changes in the business | Consumers: Make decisions | |
| Analysts: Provide input to consumers as required | ||||
| Model required processes | Interview data & current process models | Process model | Analysts: Interviewers & Modellers | |
| Consumers: Interviewees | ||||
| Adaptation lifecycle (Optional) | Models (Goals, Performance, Processes) | Adapted models | Analysts | |
| Step 3 | Model threats and opportunities (situations) | Performance model | Performance & Goal models + Situations | Analysts |
| Add required monitoring KPIs | Performance model | Performance model + New KPIs | Analysts | |
| Monitor and refine the model | Goal and performance model | Refined models and a new iteration | Analysts: Monitor and refine | |
| Consumers: Monitor |
Table 2 Detailed methodology steps, with roles
Three types of roles are involved in the implementation and usage of the methodology: analysts, BI experts, and consumer s of the artefacts (i.e., those who monitor reports and make decisions). These roles, to be further discussed later, interact with the system at different levels. In a nutshell, analysts interact the most with the system, its artefacts, and the other roles. They implement the methodology and make it available to other roles. BI experts help the analysts by providing the underlying data sources and BI systems to feed the required values to the models automatically. Finally, consumers mainly use the models for decision-making and monitor the satisfaction level of business goals and KPIs. Consumers are usually either tactical managers who monitor the performance models or strategy managers who monitor the high-level business goals.
In the first step, an initial model of the organization's goals is created (e.g., using the approach of Feng et al.). This model can be built by analysts based on interviews with executives and operational managers (i.e., consumers), as we experimented with in our examples. This goal model can consist of long-term, short-term, strategic and operational goals of the organization as well as contribution and decomposition relationships between them. Furthermore, in this step, analysts define the KPIs that support the goals (e.g., financial KPIs) and add them to the model. This can be a challenging task and is dependent on the level of maturity of the organization. For instance, in the organizations we have studied as part of this research, one small organization (retail store) had a very limited set of data and was using a spreadsheet to monitor the business while the other (a large teaching hospital) had many indicators available and was using a sophisticated Business Intelligence system. Our discussions with both organizations however demonstrate that organizations at any point within this wide range of information management capabilities can benefit from applying such a goal-based model. After defining the performance and goal models, consumers will have a better picture of their business, will identify the type of analysis they want to perform on the model and specify the new KPIs required to do so if any are missing.
In the second step, analysts explore the existing models, discover and add the new KPIs and the new dimensions to the model required to perform a better job in monitoring various aspects of the business. Note that not all the KPIs need to be dimensional and if the available data is not as granular as is required for a dimensional model, or if all the data is not available, a step-by-step approach can be used leading to a number of model iterations as additional data becomes available.
In addition, during this process analysts refine the relationships between KPIs in the goal model. These relationships create a graphical model, which can be used to analyze what-if scenarios. The relationships are defined using mathematical
formulas that are discussed comprehensively in the next sub-section. For example, a relationship between the "New customer count" KPI and the "Online marketing campaign budget" and "Flyer budget" KPIs could look like the following:
New customer count = Online marketing campaign budget in $ / (0.5$/customer) + Flyer budget in $ / (0.8$/customer)
Such formulae capturing relationships between KPIs can be refined based on historical data, for example through data mining. In cases where organizations do not have historical data and are in early stages of creating their performance model, the
initial formula used to define the KPI relationships can be based on industry standards (e.g., Gartner; World Intellectual Capital); analysts have to start somewhere, even if the relationships are not right the first time. As the organization gathers
more information, this historical data can be integrated into the model. As will be seen later in the retail example, the models can be used to illustrate the expected impact of actions taken by involved consumers and analysts.
Once a performance model is ready, as an optional step, BI experts can get involved and use that model as a reference to understand the monitoring needs of the organization and create (or reuse) the underlying BI infrastructure, including data warehouses and BI reports, to feed the performance model. This is a collaborative effort between analysts and BI experts and may result in refining the performance model by adding raw data elements to read the data directly from BI systems.
Analysts can also add a decision model and connect the model's options to the goals and KPIs of the organization. A decision model outlines the different options available to organizations to achieve their goals. This diagram helps managers to visualize the options and define GRL strategies that reflect the result of selecting one of the options. Note that this is not a new type of graphical diagram and it is only a terminology choice in our methodology to isolate the decision options from goal and performance models.
Moreover, organizations can continually adapt the models by saving the initial iteration as a "snapshot" and comparing it to actual results achieved by decisions. Gathering these snapshots will eventually create a "decision trail" that displays decisions taken and results thus allowing managers to continually improve their decisions. In addition, decision trails allow organizations to refer back to the rationale they used for making successful or unsuccessful decisions. At this time, the snapshots are not currently supported by tools at the model level, and analysts have to save various model versions and rely on BI tools and databases for snapshot capabilities. This functionality needs to be further developed in the supporting tool in the future but is out of the scope of this paper.
Furthermore, the notation used for the methodology and the modelling tool allow the organization to model business processes (with UCM) in an integrated environment with the KPI models. This often can be used when the analysts believe some of the processes in the organization need closer attention to enhance the KPIs of interest. Analysts can model the as-is and proposed to-be processes and use the KPI model to monitor the expected results. When process adaptation is considered to be an option for improving certain aspect of a business, analysts can use the process adaptation lifecycle. The latter exploits redesign patterns and aspect-oriented extensions to URN to detect improvement opportunities and dynamically adapt business processes in consequence. This lifecycle, detailed by Pourshahid, is outside the scope of this paper.
In the third step, analysts add the expected impact, if any, of the decision made in the second step to the model that illustrates either threats or opportunities involved. Such expected impact is modelled with situations, a new concept in our methodology, which is akin to situations in the Business Intelligence Model (BIM), which is focused on SWOT (Strengths, Weaknesses, Opportunities, and Threats) analysis. Situations, in this paper, capture the opportunities or threats that affect the way a business operates. For instance, investment in an online store brings the risk of reducing the profits of the business for a period of time. Using stereotyped GRL softgoals to capture situations, we are able to the show the qualitative impact of situations on the rest of the model. The most challenging aspect of this step is modelling a qualitative situation factor that influences a quantitative KPI. In this case, we model the impact by increasing the range of acceptable values for a KPI. In other words, once we have estimated the impact of the situation, we allow the acceptable range of the measured KPI to deviate accordingly from its target value.
In this third step, analysts also add the required KPIs and dimensions to the model that allows analysts and consumers to better observe the impact of decisions. If analysts expect a decision to change anything in the organization, they will examine that hypothesis using the appropriate KPIs and GRL strategies.
Finally, analysts monitor the impact of the changes made to the business or processes and compare expected results against actual results. Based on this comparison, analysts refine the models as required and record the data. Monitoring of the business could be done in several ways. Analysts and consumers can observe the results of business goals and KPIs one by one and look for signs of unsatisfied business goals and performance indicators in the models. They can also take advantage of more sophisticated reports based on BI tools, or of detection mechanisms from the adaptation lifecycle.
In summary, the methodology is based on creating an initial model, which is then refined by expanding data sources, capturing decisions made and the results of those decisions, and building historical decision trails that inform future models.