Frontiers of Business Intelligence and Analytics
To understand definitions regarding the taxonomy of BI, read this paper, where an example of the methodology in the research process is used. It also discusses how the taxonomy for BI and analysis was developed, how it is applied, and an analysis of the current status with predicted development for the next wave or 3.0 of BI, as well as potential gaps. A clear diagram of the taxonomy development process is shown in Figure 6. While a picture is worth a thousand words, sometimes you must explain complex processes narratively.
Results
After conducting the literature search, we classified each article by its meta-data and applied the developed taxonomy (cp. Sect. 4) to categorize the 75 papers provided by the literature search. By examining the meta-data, we noticed a clear trend towards BI & A 3.0 (see Fig. 10). Whereas in 2010 only four articles could be retrieved, in 2018, a total of 11 articles, addressing BI & A 3.0, was published. The linear trend line clearly points to an increasing interest in the research field.
Fig. 10
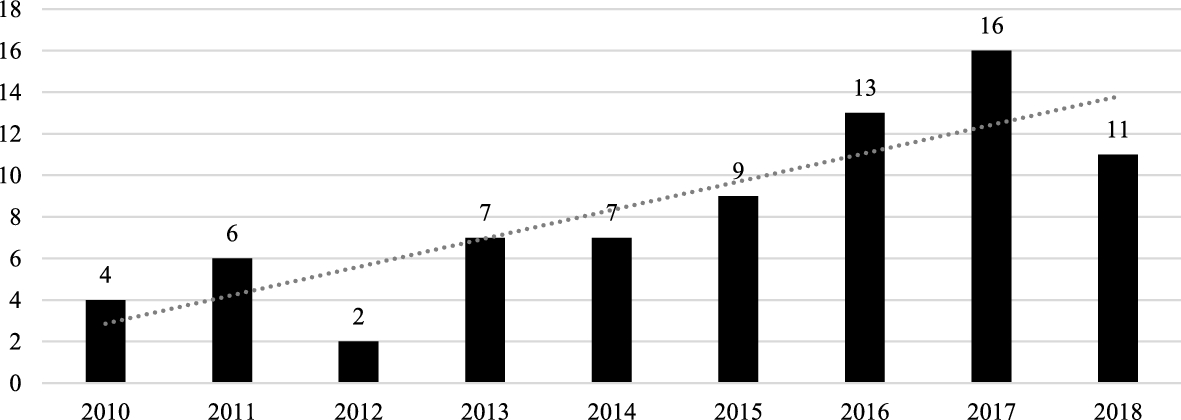
Development of published articles for BI & A 3.0
The second analysis of the meta-data focuses on the distribution of main outlets, in which articles in the area of BI & A 3.0 were published in the past decade. Figure 11 provides an overview about the most relevant scientific journals and conferences in the field. With 14 relevant articles, the journal Decision Support Systems is the top outlet for research in the field, followed by the IS conferences European Conference on Information Systems (ECIS) (eleven articles) and International Conference on Information Systems (ICIS) (nine articles). Interestingly, the MISQ, which published the inspiring article about BI & A 3.0 of Chen et al., did only publish one article in the investigated scope.
Fig. 11

Main outlets for BI & A 3.0 research
Each paper addresses one characteristic of one dimension in the developed taxonomy (except research methods, which might be addressed twice by papers that apply a multimethod approach). Figure 12 contains the applied taxonomy and provides the summarized hits of each characteristic. Additionally, we provide the details of our analysis in Appendix D. In the following, we briefly introduce the results in each dimension. Thereby, we focus on outliers.
Fig. 12

Summarized results of the literature review